Measuring What Matters
![]()
Retailers should focus on supply chain outcomes, not just forecast accuracy metrics, when gauging success of inventory optimisation efforts.
Retailers commonly track forecast accuracy improvement to measure performance of their demand forecasts. Whilst forecast accuracy is certainly a metric that should be tracked, retailers need to be wary of drawing incomplete conclusions if this is where their analysis begins and ends. Why? Biased forecasts can obscure significant gains of key performance measures such as out-of-stock rates or inventory turns… in other words, metrics that directly impact turnover and profitability.
Mean absolute percentage error (MAPE) or root mean square error (RMSE) are often used by retailers to judge the accuracy of forecasts. Though widely used, these measures can be flawed when evaluating the efficacy of point solution overrides, especially in the presence of biased forecasts.
In our work with retailers, Planalytics has typically found some level of positive bias in forecasts, often in the +5% to +20% range. Whether this is intentional to ensure high service levels or due to challenges from in intermittent demand, this bias has proven to be persistent across all types of retailers and demand forecasting applications.
At a macro forecasting level, this bias may not pose obvious problems. For example, when choosing the optimal time series forecasting methodology (e.g. AVS Graves vs. Exponential Smoothing), some combination of error and bias factors will allow a retailer to choose which method they believe will maximise supply chain outcomes. However, biased forecasts will mask the effectiveness of point solution overrides.
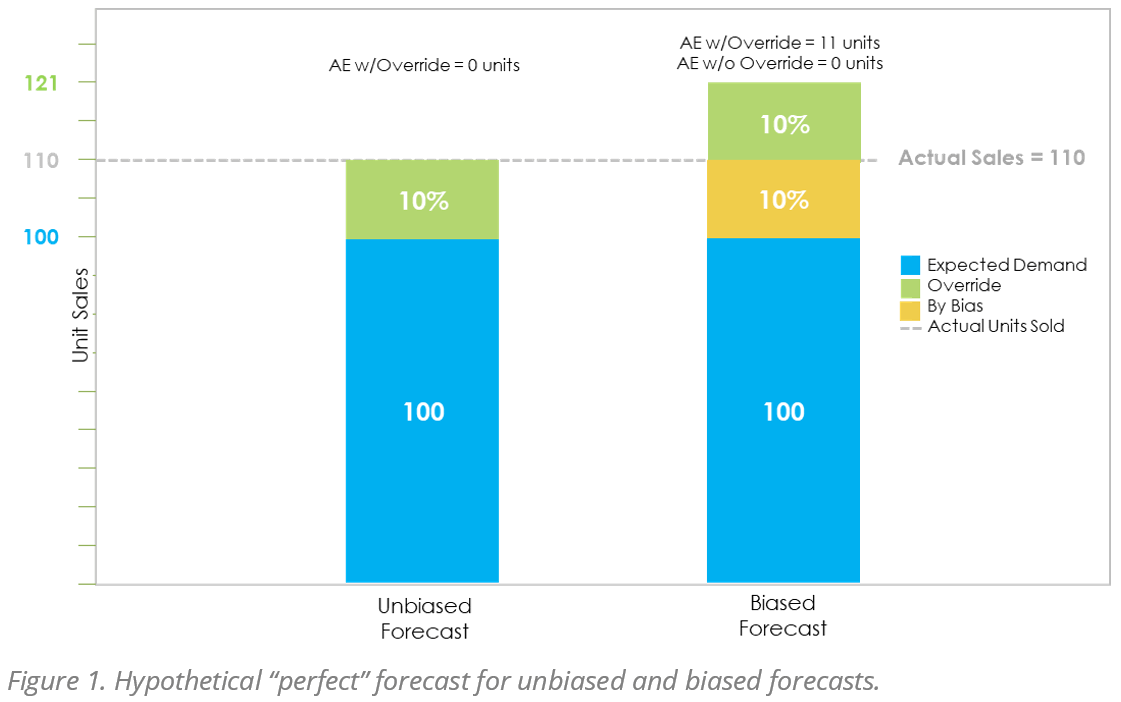
Consider the following hypothetical scenario in which a demand forecast has an average bias of 10%. Figure 1 illustrates how the override – although “perfect” in that the base forecast with the adjustment exactly match observed demand – will appear to have a negative effect if only measured by forecast accuracy.
This hypothetical forecast assumes a perfect unbiased demand forecast of 100 units, a perfect forecast override of 10% and a known +10% bias to the forecast. When calculating the error rates from this “perfect” forecast, we see that the biased forecast appears to have an error rate of 0% while the biased overridden forecast has a MAPE of 10%. This result is despite the fact that the override exactly captures the increased demand. It is easy to see how a retailer can come to incorrect conclusions about the improvements that are being provided by the override and the accuracy of biased baseline forecast.
To more accurately gauge the effectiveness of forecast overrides, retailers utilise a before and after A/B testing approach such as difference-in-differences.
The difference-in-differences approach compares performance of supply chain metrics like out-of-stock rate or turn rate before and after implementation of a new forecasting technique. The test can be set up either as a comparison between stores or between products. The economists who popularized the difference-in-differences methodology recently won the Nobel Prize in Economics, further validating the above measurement methodology (The Royal Swedish Academy of Sciences 2021).
An increasingly common demand forecast adjustment or override that retailers look to address is the weather’s impact on consumer purchasing. This is no surprise as the weather is constantly changing and it continually and significantly alters consumer demand. Projecting how much (% or unit volume) demand will increase or decrease due to the weather across products and stores via overrides to the base forecast is a proven way to limit both understocking and overstocking specific products and categories in different locations (that will experience different weather-influenced demand trends).
Using an example in which Planalytics’ Weather-Driven Demand (WDD) outputs are used as forecast overrides will show how real financial gains may get overlooked when forecast accuracy improvement is the only metric evaluated. In a comparison (Figure 2) of the baseline difference in out-of-stock rate pre- and post-WDD overrides over the course of several weeks one can see how this disconnect can occur. The difference between the baseline and post-implementation out-of-stock rates is the treatment effect from the methodology change.
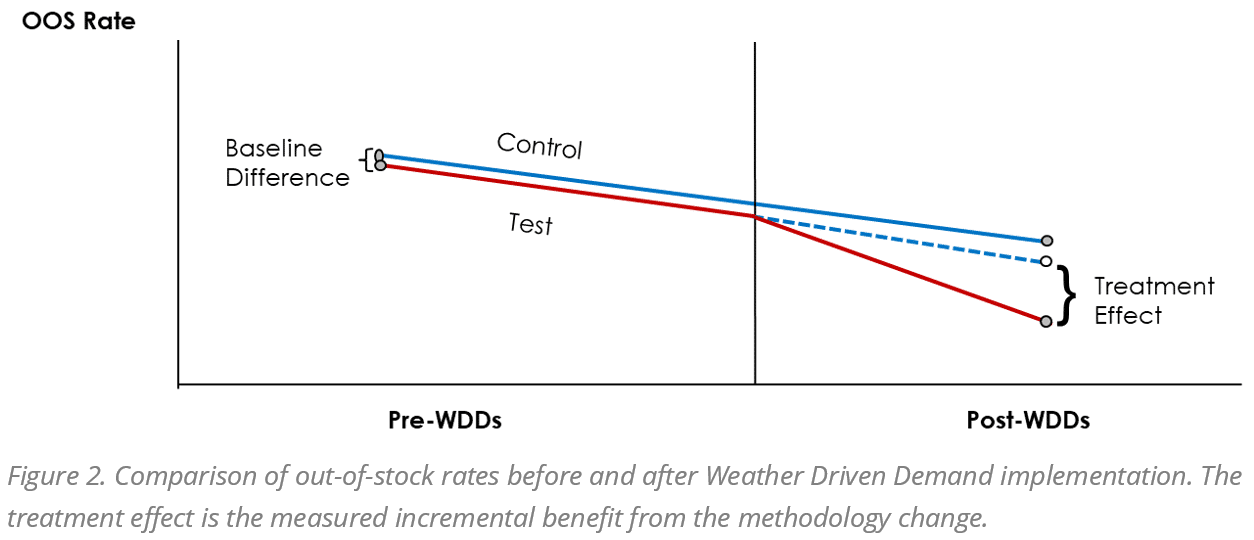
Instead of looking at changes in MAPE which (as was shown earlier) can produce spurious conclusions, the difference-in-differences approach on out-of-stock (OSS) rate illustrates the exact effect WDD forecast overrides have on the relevant supply chain outcome. In the end, it is this measurement of benefit and its financial value that ultimately matters to a business.
The example above using Weather-Driven Demand forecasts generate a measurable 100-200 bps improvement in out-of-stock rates, 5-10% reductions in on-hand inventory, and 7-15% reductions in shrink for perishable items. In calculating bottom line financial return that results from improvements in these key business metrics, retailers typically capture EBITDA gains between 2-5 million for every 1 billion in revenue exactly captures the increased demand. It is easy to see how a retailer can come to incorrect conclusions about the improvements that are being provided by the override and the accuracy of biased baseline forecast.
David Frieberg, VP Marketing
dfrieberg@planalytics.com
![]()