Weather-Based Sales Sensitivity During the Holiday Shopping Season
Retail’s Q4 (for most, November through January) and the critically important Christmas and holiday shopping season is nearly here. The question on everyone’s mind…: how strong will retail sales be?
RIS summarized some of the outlooks in their fourth annual guide to peak selling season:
- Holiday retail sales are likely to increase between 3.5% and 4.6% in 2023 for the November-January timeframe, according to Deloitte’s annual holiday retail forecast. Deloitte also forecasts e-commerce sales will grow between 10.3% to 12.8% year-over-year during the 2023-2024 holiday season.
- Bain & Company forecasts nominal U.S. retail sales to slow this holiday season, with the lowest growth rate since 2018. Unadjusted seasonal sales are expected to grow 3% year-over-year in November and December… However, adjusting for inflation, real U.S. holiday retail sales growth will be sluggish at just 1.0%.
Then there’s a WWD article reporting that PwC is “predicting holiday spending to surge to its highest level recorded with a 7 percent increase in spending compared to 2022.”
Not exactly a consensus on how the season will unfold and the continuing uncertainty regarding the overall economic environment facing consumers likely accounts for some of the forecast differences. In addition to the economic backdrop, there is another key external factor these outlooks and many retailers tend to overlook – the weather.
Weather sensitivity is one of the metrics Planalytics generates during its weather impact modeling process. Weather sensitivity quantifies the portion of total box or specific product sales are directly attributable to changes in the weather. The image below shares average weather sensitivity metrics for the U.S. over the November to January period. Although it should be noted that these percentages will be different for specific markets/regions and time periods.
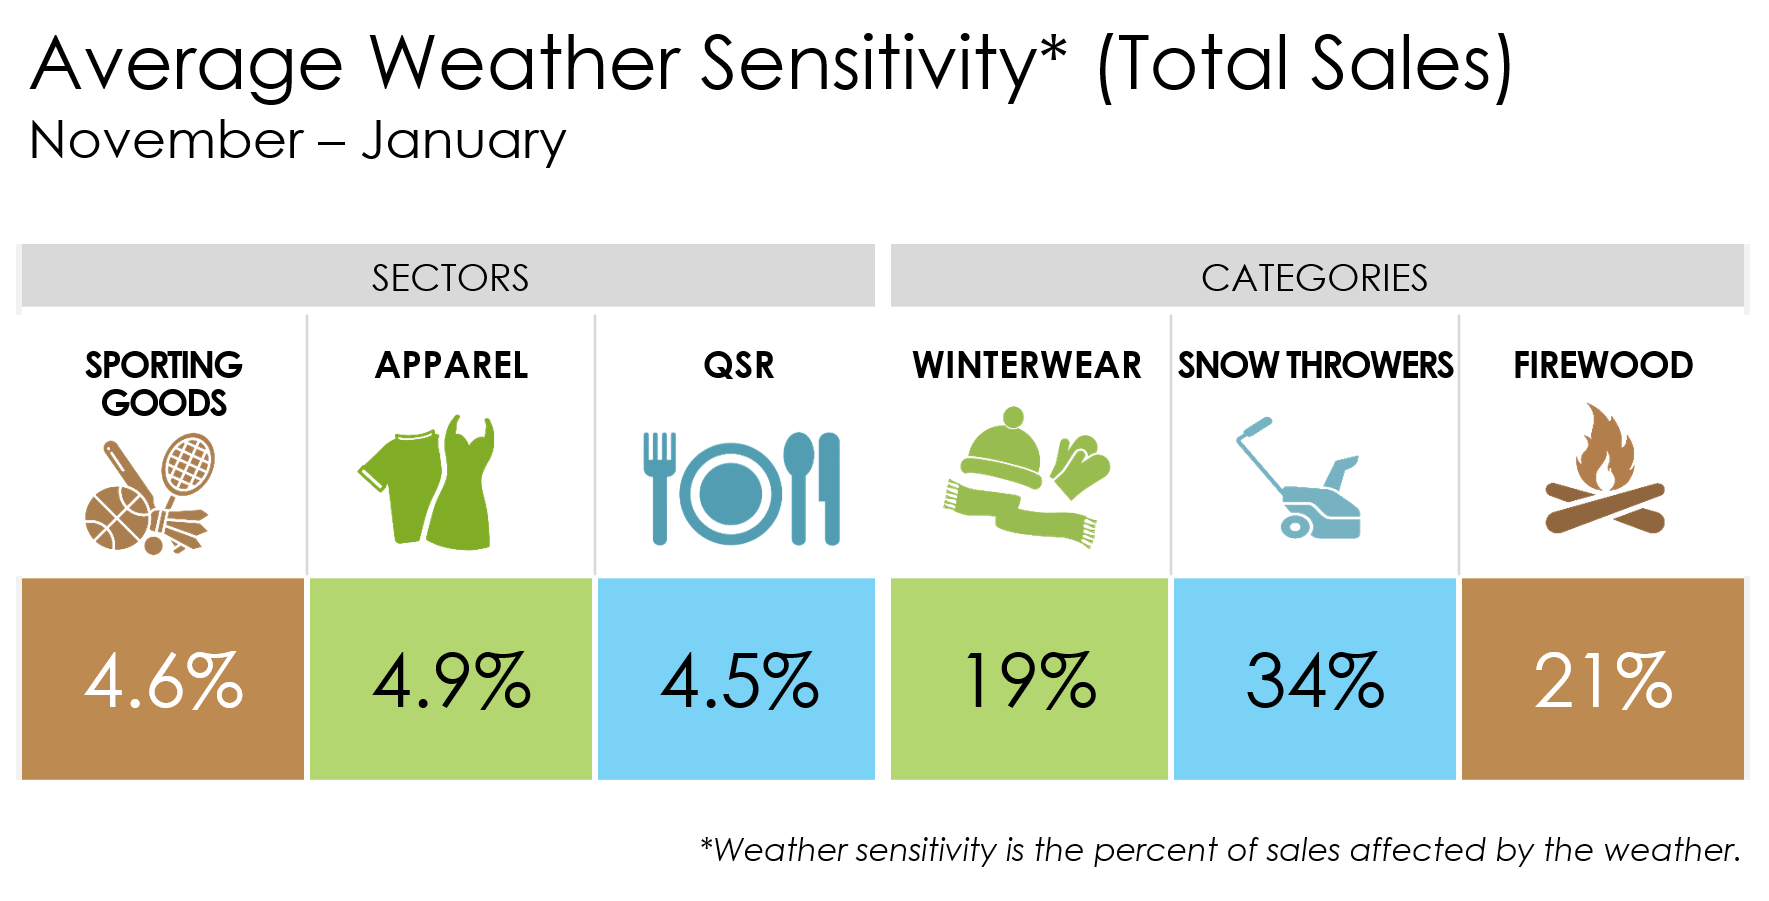
Sector-level sensitivities can translate into millions of topline dollars – to the positive or the negative – as it applies to a retailer’s total sales. Specific seasonal product categories, including the examples above, are generally subject to larger swings and oftentimes have sensitivities of 10-25% or higher.
How can weather sensitivity impact sales? Let’s look at an example. In November 2022, the consumer’s response or “sensitivity” to much colder-than-normal temperatures in western states led to strong Weather-Driven Demand (WDD) for winter items. WDD is a measure of how much the weather alone increases or decreases sales.
- PORTABLE HEATERS: +29% WDD vs. normal in Salt Lake
- ELECTRIC BLANKETS: +24% WDD vs. normal in San Francisco
- OUTERWEAR: +16% WDD vs. normal in Dallas
- BOOTS: +15% WDD vs. normal in Spokane
- FLEECE: +13% WDD vs. normal in Phoenix
The post-holiday period of January 2023 provides an example in terms of topline impacts for apparel specialty stores. Last January was the warmest since 2006 for the nation overall and many markets in the eastern half of the country recorded their warmest January in 50 or more years. The extreme warmth in the middle of the winter severely curtailed snow and other traffic-impeding wintry conditions. The result: Planalytics calculated that apparel stores benefited from a $601 million topline boost compared to the prior year. The unseasonable conditions enabled more shoppers to get out stores to cash in gift cards and take advantage of after Christmas sales.
For weather-driven demand insights this holiday season please sign-up for updates.