Watch Your Bias! How Forecast Accuracy Measurements Can Mask True Performance
Most retailers use forecast accuracy improvement to measure performance of their demand forecasts. Typically, they use widely known, easy to calculate measures like mean absolute percentage error (MAPE) or root mean square error (RMSE) to judge the accuracy. These measures however may be flawed when evaluating the efficacy of point solution overrides, especially in the presence of biased forecasts. Planalytics suggests measuring supply chain outcomes such as out-of-stock rates or turn rates as a better way of evaluating override performance.
In our experience, every retailer has some level of positive bias in their forecast, typically ranging from +5-20%. This could be due to challenges with intermittent demand, or it could be intentional as a way to maintain service levels. Either way, this bias is persistent across all types of retailers and demand forecasting applications.
This does not pose serious problems for macro forecasting exercises. For example, when choosing the optimal time series forecasting methodology (e.g., AVS Graves vs. Exponential Smoothing), some combination of error and bias factors will allow a retailer to choose which method they believe will maximize supply chain outcomes. But when evaluating point solutions, biased forecasts will mask the effectiveness of the override.
If a demand forecast has an average bias of 10%, most small overrides will appear to have a negative effect if only measured by forecast accuracy. We demonstrate this in Figure 1 by using a hypothetical “perfect” forecast situation where the base and override values exactly reflect the demand observed. This hypothetical forecast assumes a perfect unbiased demand forecast of 100 units, a perfect forecast override of 10% and a known +10% bias to the forecast.
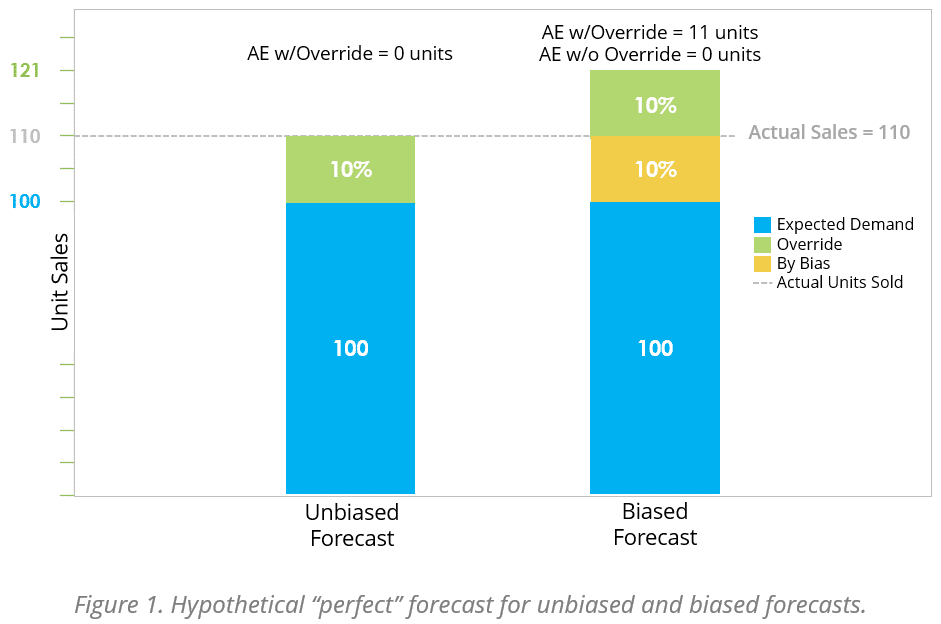
When calculating the error rates from this “perfect” forecast, we see that the biased forecast appears to have an error rate of 0% while the biased overridden forecast has a MAPE of 10%. This result is despite the fact that in the hypothetical, the override exactly captures the increased demand. This may lead to incorrect conclusions about the improvement that are being provided by the override.
Instead, Planalytics proposes using a forecast value based approach to measure the benefits of forecast overrides (Griswold 2021). Specifically, when measuring the performance of new overrides added to a forecasting system, retailers should measure using a before and after A/B testing approach like difference-in-differences.
The difference-in-differences approach compares performance of supply chain metrics like out-of-stock rate or turn rate before and after implementation of a new forecasting technique. The test can be set up either as a (a) comparison between stores, which is more useful for limited scope pilots or (b) between products, which is better to measure ongoing performance for a full implementation. The economists who popularized the difference-in-differences methodology recently won the Nobel Prize in Economics, further validating the above measurement methodology (The Royal Swedish Academy of Sciences 2021).
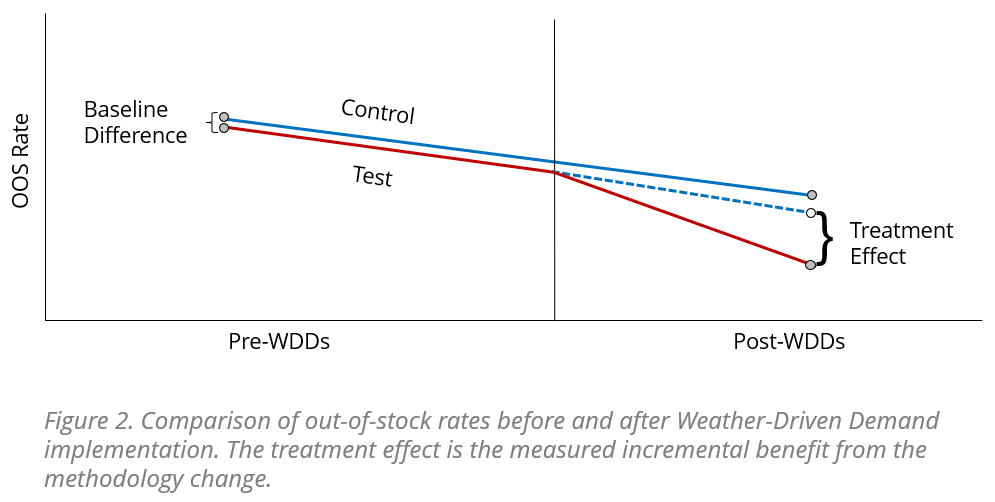
Figure 2 shows how the comparison works when comparing the baseline difference in, for example, out-of-stock rate prior to a forecast methodology change. In this case we apply Planalytics’ Weather-Driven Demand (WDD) metrics to the new difference in out-of-stock rate after the change. Weather-Driven Demand (WDD) isolates and precisely quantifies (as a %, $ or units/volume) the impact of weather variability on overall transactions and the sales of specific products and services. WDDs are typically aggregated across several weeks’ worth of data to make the sample size meaningful. The difference between the baseline difference and post-implementation difference in out-of-stock rates is the treatment effect from the methodology change.
Instead of looking at changes in MAPE, which as was shown earlier can produce spurious conclusions, we can now determine the exact effect a forecast override has on the relevant supply chain outcome. It is this measurement of benefit and determination of financial value that ultimately matters to a business. Planalytics WDDs being used as the forecast overrides typically generates a measurable 100-200bps improvements in out-of-stock rates, 5-10% reductions in on-hand inventory and 7-15% reductions in shrink for perishable items. Translating these KPIs into bottom line financial value return, retailers can expect to receive $2-5MM in EBITDA increases per $1B in revenue when using Planalytics WDDs in their demand forecasts. Although these metrics can be difficult to measure without using an evaluation system like difference-in-differences, they clearly matter more to the bottom line financials of a business than forecast accuracy.
References
Griswold, Mike. “Market Guide for Retail Forecasting and Replenishment Solutions.” Gartner. 24 February 2021
The Royal Swedish Academy of Sciences. “Answering Causal Questions Using Observational Data.” Scientific Background on the Sveriges Riksbank Prize in Economic Sciences in Memory of Alfred Nobel. 11 October 2021.