![]() Retailers have long recognized that the weather conditions outside directly affect the daily activities a person chooses to pursue and their purchasing decisions. But what are the exact relationships between the weather and sales, how do they change by product and through the year and across geographies and for a myriad of shopper profiles, traits, and trends?
Retailers have long recognized that the weather conditions outside directly affect the daily activities a person chooses to pursue and their purchasing decisions. But what are the exact relationships between the weather and sales, how do they change by product and through the year and across geographies and for a myriad of shopper profiles, traits, and trends?
In order to manage the ever-shifting landscape of sales opportunities and risks going forward, retailers need to move beyond recognition and be able to “put a number” on the weather’s business impacts. Starting with a Weather Impact Analysis for Retailers enables businesses to do just that and to get on an accelerated path to proactively managing the influence of weather variability on financial performance.
Get a Comprehensive View of the Weather’s Business Impacts
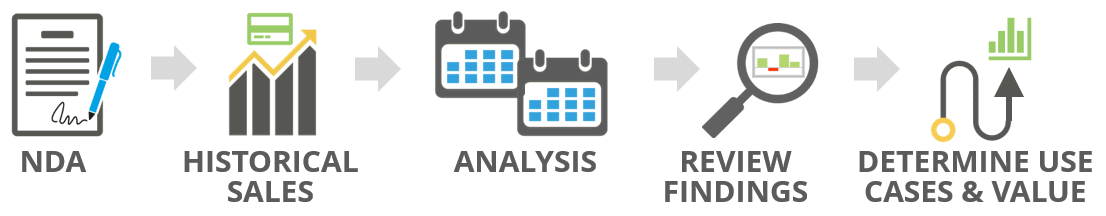
Planalytics’ Weather Impact Analysis (WIA) is a quick-turnaround deliverable (typically 8-10 weeks) designed to precisely measure how changes in the weather affect sales. Planalytics’ detailed product-level by store/market by day/week analyses produce highly valuable, retailer-specific weather impact insights. The WIA will combine the retailer’s historical sales data with corresponding location-specific meteorological data. A few weeks later, once the modeling has been completed, Planalytics reviews the results of the WIA findings, highlighting product-level weather sensitivities, the related revenue volatility, and the forecast accuracy gains. The resulting business benefits including service level/availability
Deliverables
Key deliverables may include:
- Weather Sensitivity Analytics
The percentage of sales for the company overall and on category-by-category basis that are influenced by the weather. Product and/or market level examples will be reviewed. - Forecast Accuracy Improvement
Mean absolute percentage error (MAPE) improvements within and across categories, based on weather-driven demand adjustments to the forecast baseline. - Financial Benefit Projection
Using inventory turn and service level information, Planalytics applies forecast error improvement metrics across product-level revenues to calculate annualized reductions in areas including inventory carrying costs, lost sales, and waste (where applicable).