Retail WeatherSpend℠ Report: June 2025
- Cooler temperatures in the East negatively affected year-over-year store traffic and demand for summer products for the first three weeks of the month.
- The West also started cool, then experienced a spell of excessive heat mid-month.
- The most favorable conditions occurred along the Northern Tier, where temperatures were consistently warmer than those of last June, boosting sales of seasonal items.
- Overall, the US experienced its wettest June in the last six years, with significant rainfall in the Southern Tier, Mid-Atlantic, and Intermountain West.
- For reference, June 2024 was the hottest in the past 60+ years in the U.S..
Sector-Level Weather Impacts vs. Last Year
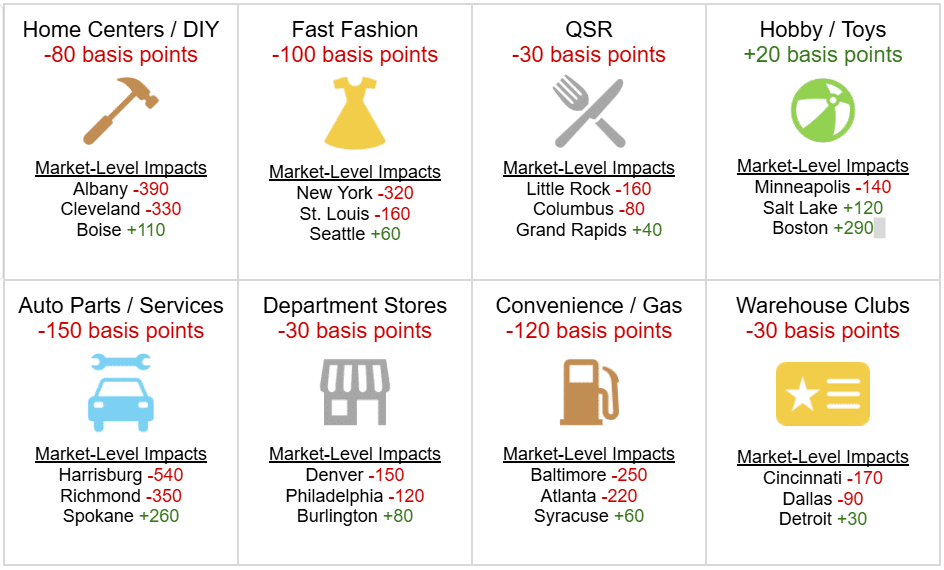
The following WeatherSpend metrics quantify how much the year-over-year change in weather positively or negatively impacted topline sales by retail sector in June.

Planalytics generates the WeatherSpend analytics highlighted above in partnership with Facteus, the #1 provider of consumer transaction data and insights. WeatherSpend metrics isolate the impact of the weather on spending for retail sectors and specific businesses. Transaction data is sourced directly from banks, credit unions, and fintechs.
A time and place for everything… including sales opportunities!
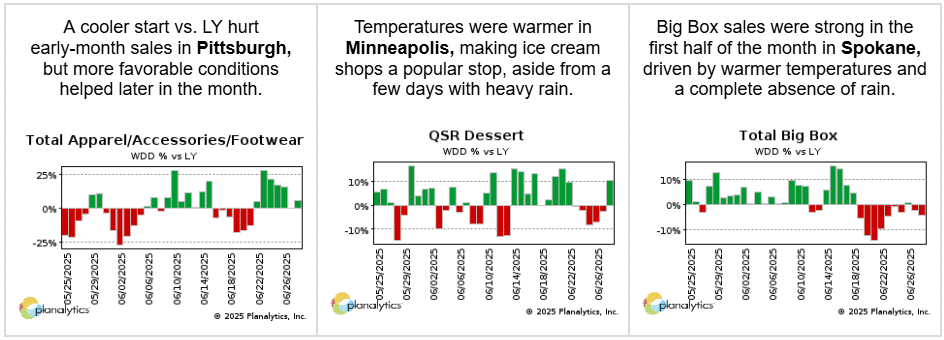
Although the “weather comp” in June was challenging for many businesses, favorable weather did support sales at times. Planalytics provides visibility into these weather-driven spending shifts, enabling companies to optimize their inventories, operations, digital marketing, and more, capitalizing on opportunities as they arise. Below are some examples of weather-driven demand variability in specific markets and sectors in June.
LEARN MORE
Check out what our clients are saying.
Read the “Climate-Proofing Retail” white paper co-authored with the National Retail Federation.
Contact Planalytics to learn how weather impact analytics can help your business.

