Why the Same Temperature Can Feel Different Somewhere Else
FiveThirtyEight published an interesting article (“Why The Same Temperature Can Feel Different Somewhere Else”) discussing how reactions to the same weather conditions are all “relative” based on a person’s location and related cultural norms.
“In much of the United States, the high 80s in Fahrenheit is hot, but it’s not hot-hot. It could even be a day of sweet relief in the South, maybe time for a family picnic. But last month, across the United Kingdom, headlines warned of temperatures that could hit 31 degrees Celsius. When Americans found out that translated to 88 degrees Fahrenheit, they quickly concluded: “Europeans are weak.” And while temperatures in Europe kept going up, eventually hitting levels even Texans would find daunting and killing thousands of people across the continent, the question of how a temperature could mean serious danger in one place while being an average summer Saturday in another remained.
The temperature may be an objective number, but how we experience it is not. Culture influences the biology and psychology of thermal comfort, shaping what our bodies are used to dealing with and how our homes and businesses are set up to adapt.”
At Planalytics, where we help retailers and other consumer-based businesses quantify and forecast how much demand for a product or service will increase / decrease due to the weather, the points made in this article are certainly confirmed by the metrics we produce for clients daily.
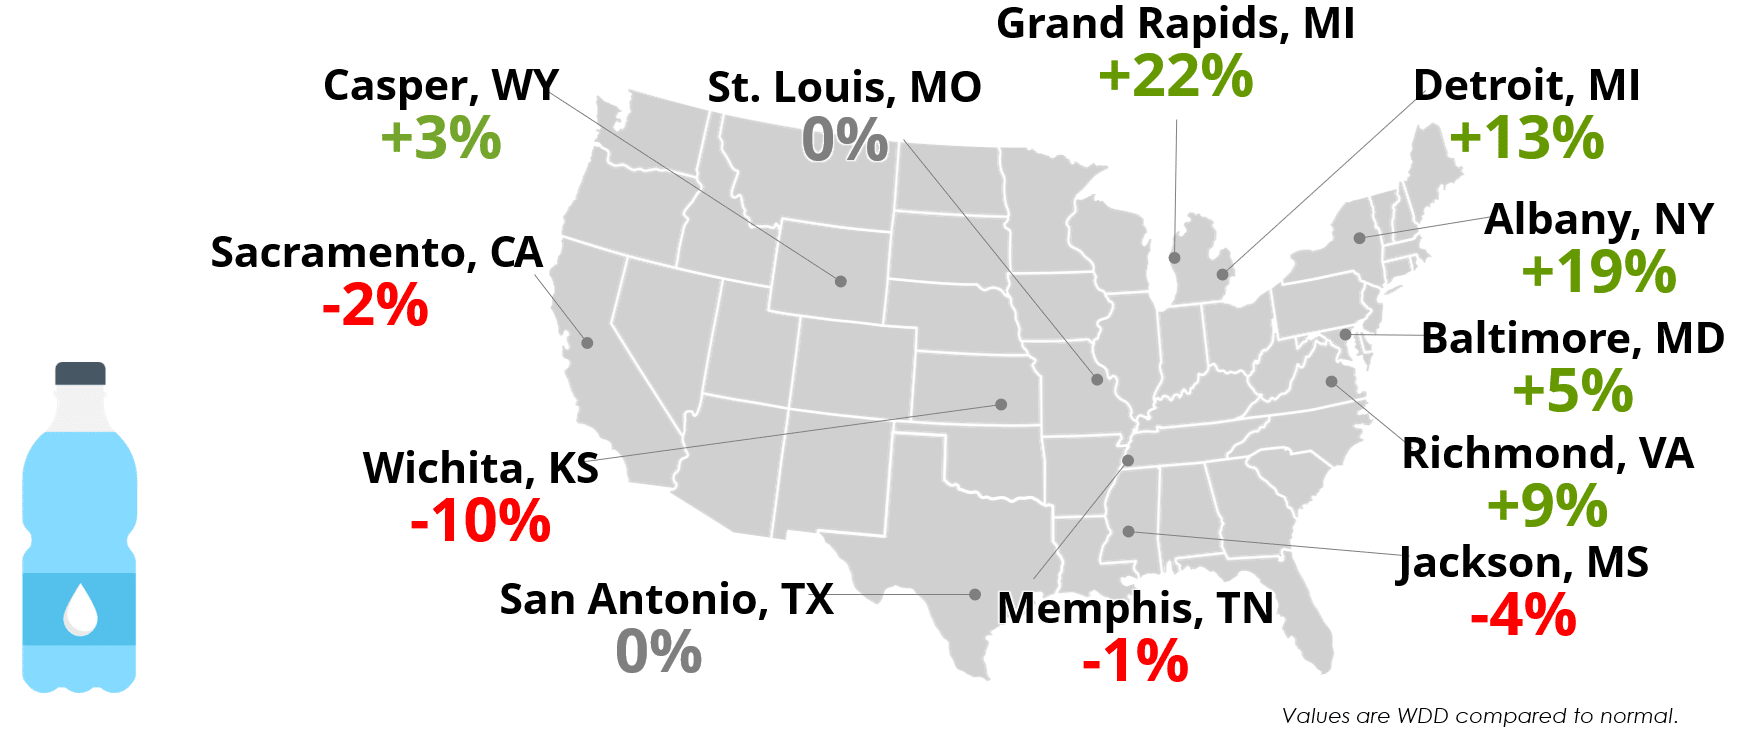
The below example for a very basic commodity product – bottled water – illustrates the subjective nature of temperature on different populaces. Weather-Driven Demand (WDD) analytics isolate and measure the impact that the weather alone has on demand. The graphic below shows the large variance in WDDs for different U.S. cities that all experienced high temperatures in the low 90s during a mid-July period. The WDDs indicated the increase / decrease this temperature level had on bottled water demand compared to each location’s normal for that time of year.
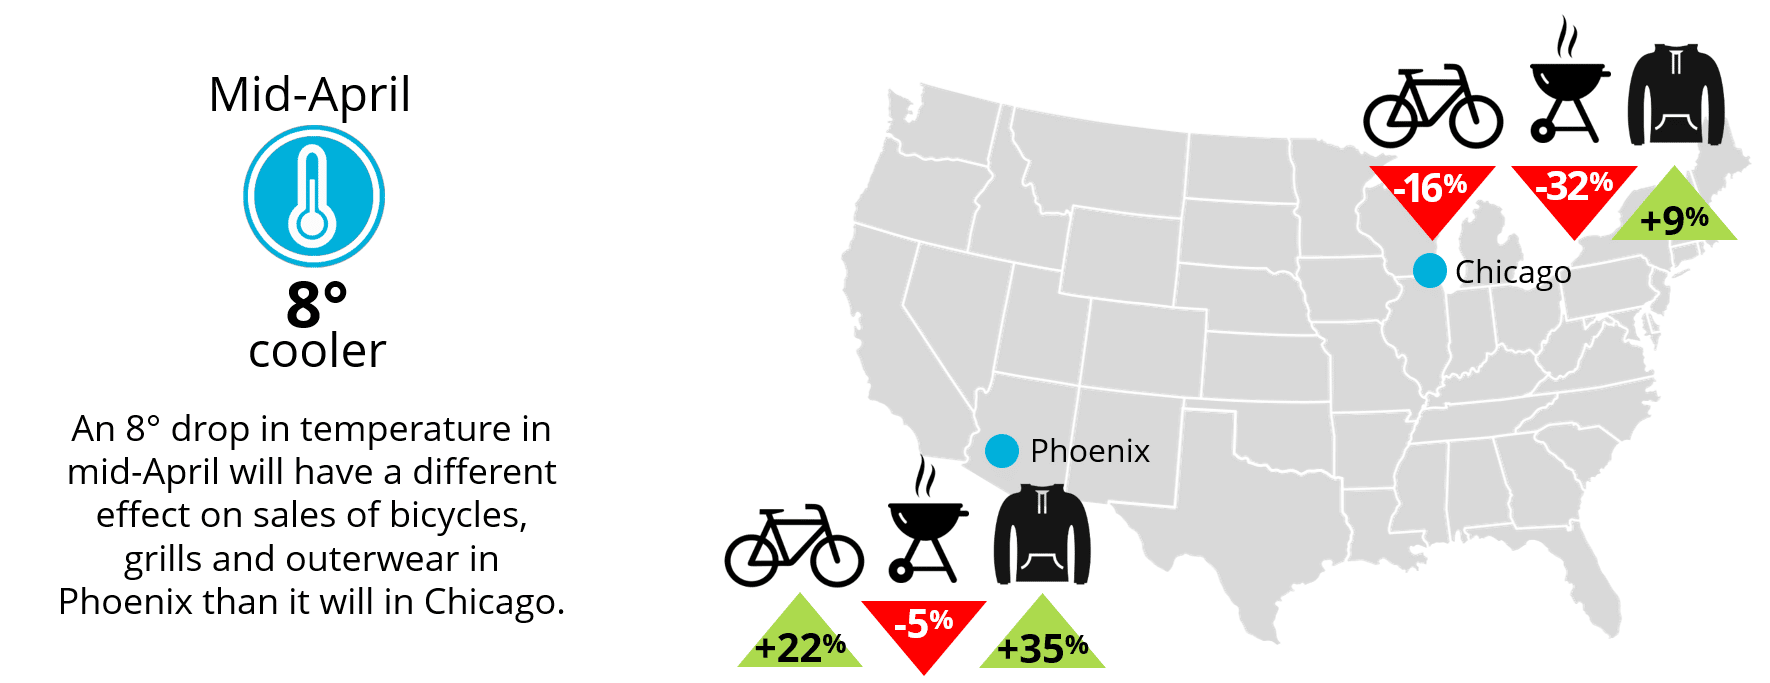
In addition to looking at different responses to identical absolute metrics such as a temperature or a heat index, the changes in weather measures for people in a particular location and a particular time of year has a significant impact on the activities people pursue and the products they purchase. Whether it is a change from what’s normal or what the recent weather situation has been, consumer reactions are again localized in nature. The below example, shows how differently demand for three products will change with an 8 degree drop in temperature in Mid-April:
And while the FiveThirtyEight article highlights temperature, other weather components like rain or snow and the combination of those factors add further complexity in terms of behavior and consumer purchasing. Planalytics applies advanced statistical methods and machine learning, mountains of sales data, years of unmatched retail demand expertise to the most omnipresent external influencer of purchasing — the weather — to help businesses understand, quantify, and proactively manage the never-ending impacts. Learn more at www.planalytics.com.